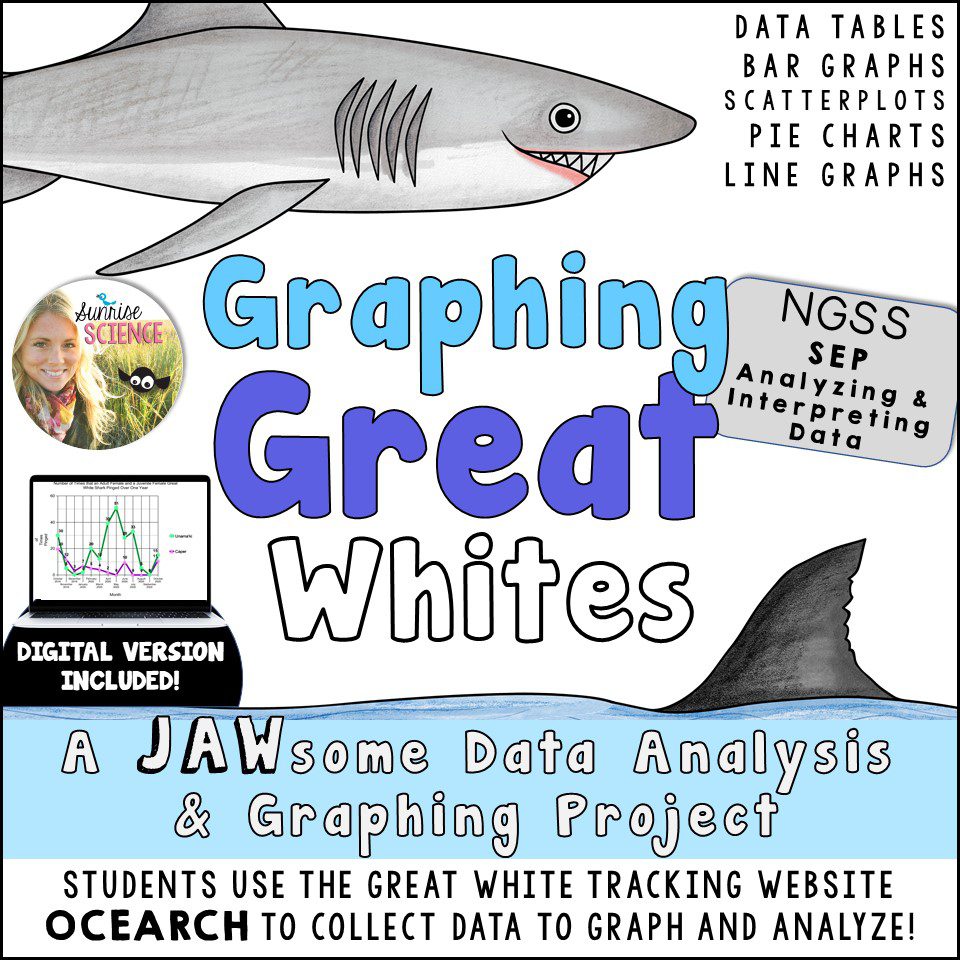
Kids are fascinated by the mysterious and terrifying Great White Shark! For this fun digital graphing project, your middle school students will create digital graphs of real Great White Shark data. They will collect their data from the amazing website Ocearch.
What is Ocearch?
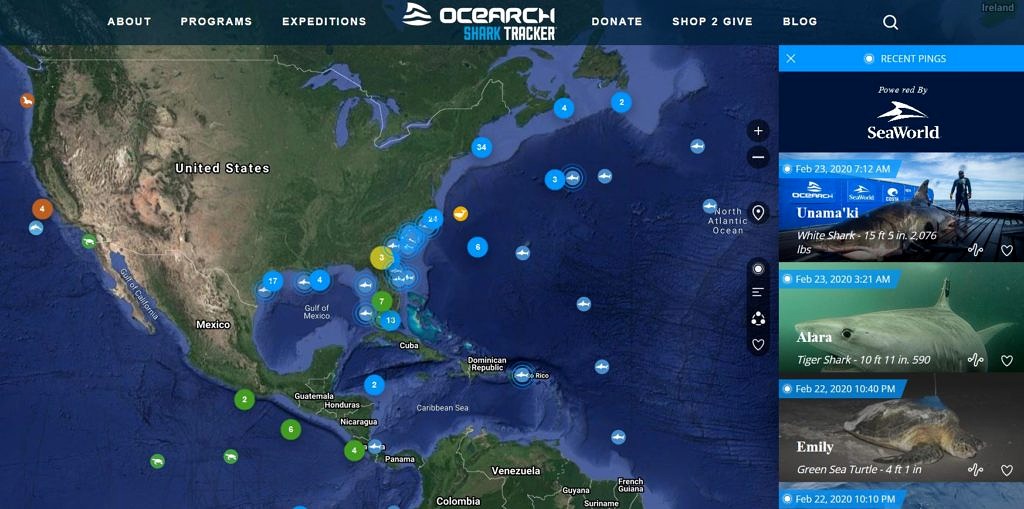
Ocearch is a scientific data collection organization that tracks the movement of Great White and other shark and marine species around the globe.
The sharks are captured, tagged, and released back into the ocean. When the dorsal fin of these tagged sharks comes to the surface of the ocean, they ‘PING’ a satellite orbiting Earth. The satellite then sends the shark’s location information to the Ocearch database.
I use this project right after I finish my Intro to Earth and Space Science unit once we have discussed satellites and how they are used to study the planet.
A Jawsome Opportunity to Combine Real Data Collection and Graphing Skills!
Your students will collect their own data about the name, age, length, weight, location, and distance traveled of many enormous Great Whites.
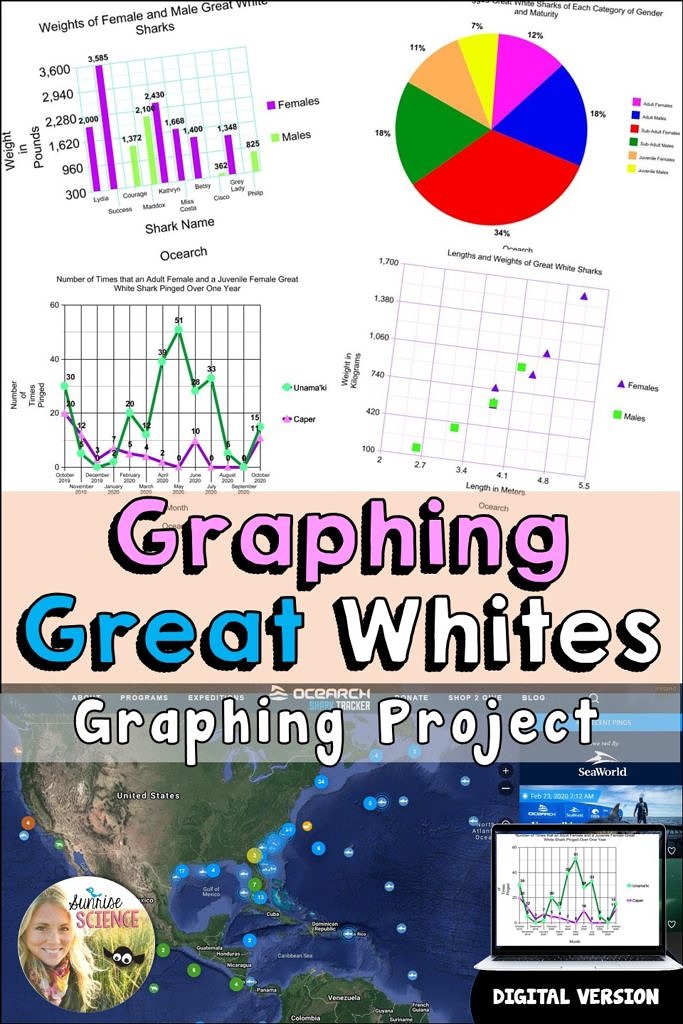
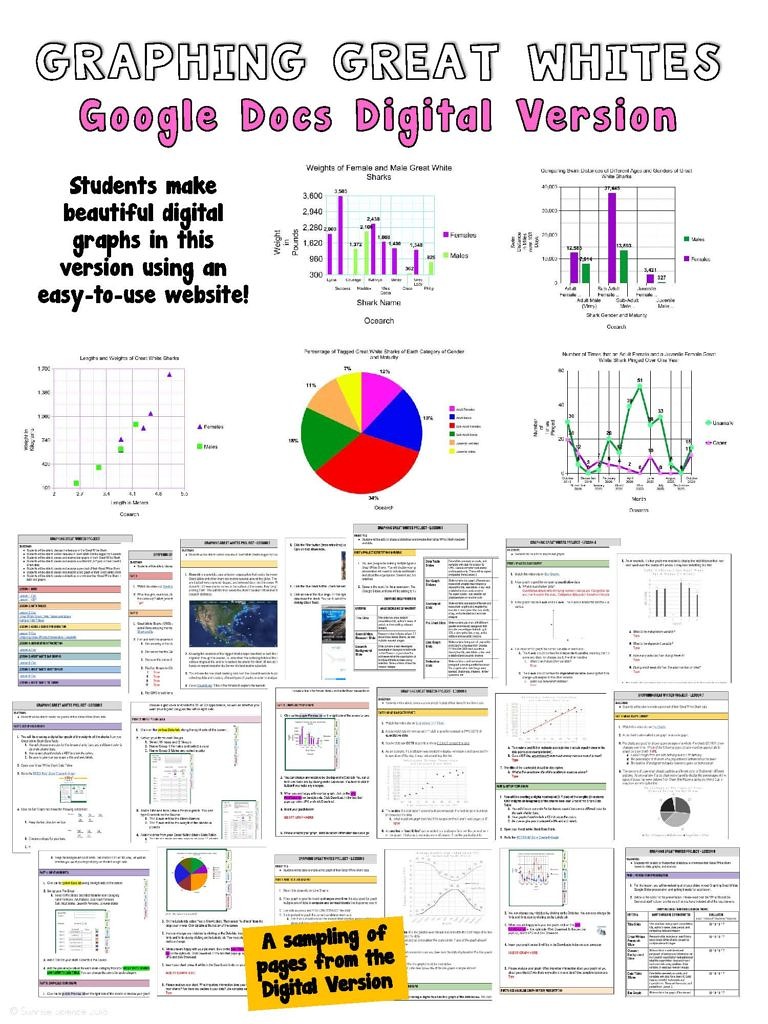
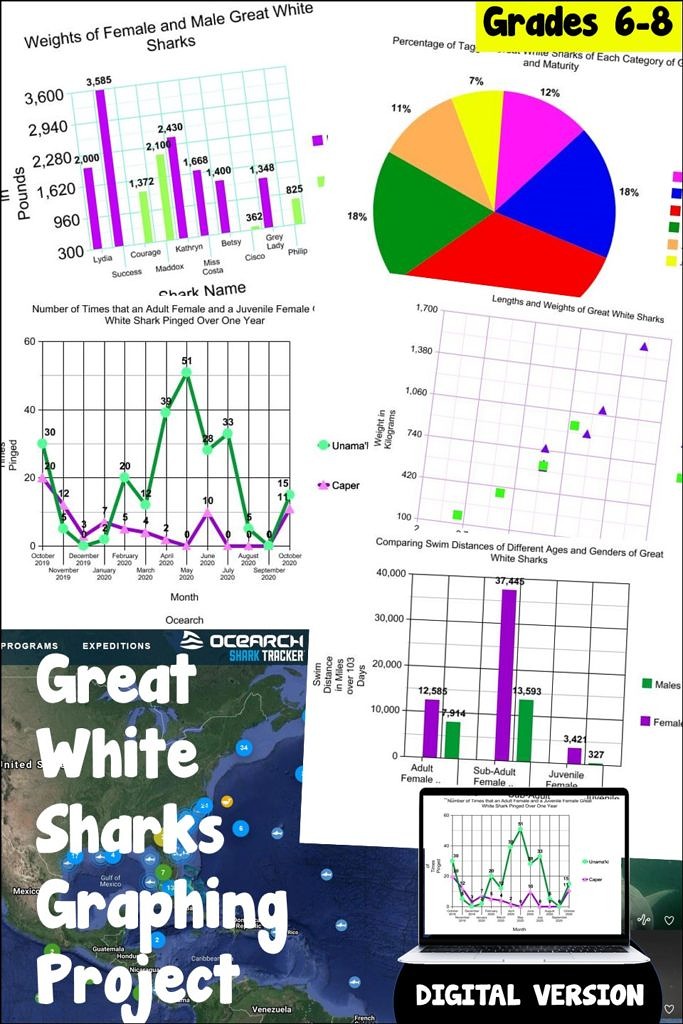
They will learn about 4 different types of graphs–- bar graphs, scatterplots, pie charts, and line graphs.
They will practice graphing different data that they collect using the Ocearch database by creating 5 (optionally 6) different graphs. Students will graph various combinations of data such as the sharks’ weight vs. length, swim distance vs. maturity level, weight vs. maturity level, percentage of sharks tagged by Ocearch in each maturity level, etc.
Digital Version – A Lasting Success!
A few years ago, I updated this activity with a completely digital version so that I could use it for hybrid learning with my 6th grade Earth and Space Science classes. Half of my students were in person each day while half were virtual. I needed a way to deliver this project completely digitally, including having the students create digital graphs.
The project went perfectly, the students LOVED collecting data and learning about Great White Sharks, and their digital graphs and final presentations came out beautiful. I’m so excited for more teachers to use this digital version of the project so I want to share how I facilitated it.
I have been using the digital version every year since I created it. Here are some examples of the cumulative slideshow project for which students showcase their graphs and analysis:

How I Facilitated the Digital Version of this Project
The digital version of this graphing project contains 9 lessons, each of which can be delivered via Google Classroom. Some of the lessons take my 6th grade classes one day and some take two days.
Overall, the project lasts two weeks. Students’ objective is to develop a final presentation that showcases all of their graphs and research.
On day 1, I introduce the project by having students watch a video of the Ocearch team capturing, tagging, and releasing the amazing Mary Lee. She is an enormous 16-foot, 3500 pound beast! For the rest of that class, the students go information hunting on a Smithsonian website about Great Whites.
On day 2, the students collect data about Great White Sharks of their choice on Ocearch. They quickly understand how Ocearch is organized and they love choosing their sharks.
On day 3, I provide the rubric for the final presentation and have students set up the slides in their presentation. Throughout the project, they go back into their presentation in lesson 3 to add their graphs and analysis. The presentation must also include a title slide, a Great White research slide, an Ocearch research slide, their data tables, and a reflection slide at the end. The expectations are made clear from the beginning and this really helps my students to succeed in putting together beautiful presentations.
In lessons 4 through 8, students learn about four different types of graphs: bar graphs, scatterplots, pie charts, and line graphs. For each lesson, students learn about the graph and then they are provided clear directions for how to create that type of graph using the National Center for Education Statistics Kids’ Create-A-Graph website (an AMAZING graphing resource for middle schoolers!)
Involve Me and I’ll Understand!
My students are easily able to input their shark data to the website.
Their graphs turn out beautiful.
They are SO engaged and proud of their work!
Every day, students ask me excitedly at the beginning of class, “Are we making a new type of graph today?!” The math teacher on my team is psyched when they start discussing graphs in her class. Our students will undoubtedly remember what they learned during this graphing project!
I used to do a paper-pencil version of this project. I have updated this resource to include the digital version for teachers who need to teach graphing in remote or hybrid formats, or who just LIKE to deliver the content digitally, like I do!
If you’re interested in checking out this project to use as a hard-copy or digital version, please click on the button below!